

Equipment cost reports and integrationsThe numbers are ready; the data arrives by itself.
12 ready-made reports and budget tracking need no extra data entry; they are calculated from current records each time they open. Telematics, vehicle tracking and fuel card data reach the daily log without manual entry; costs flow to your accounting software and invoices are matched to records.
01MACHINE COST
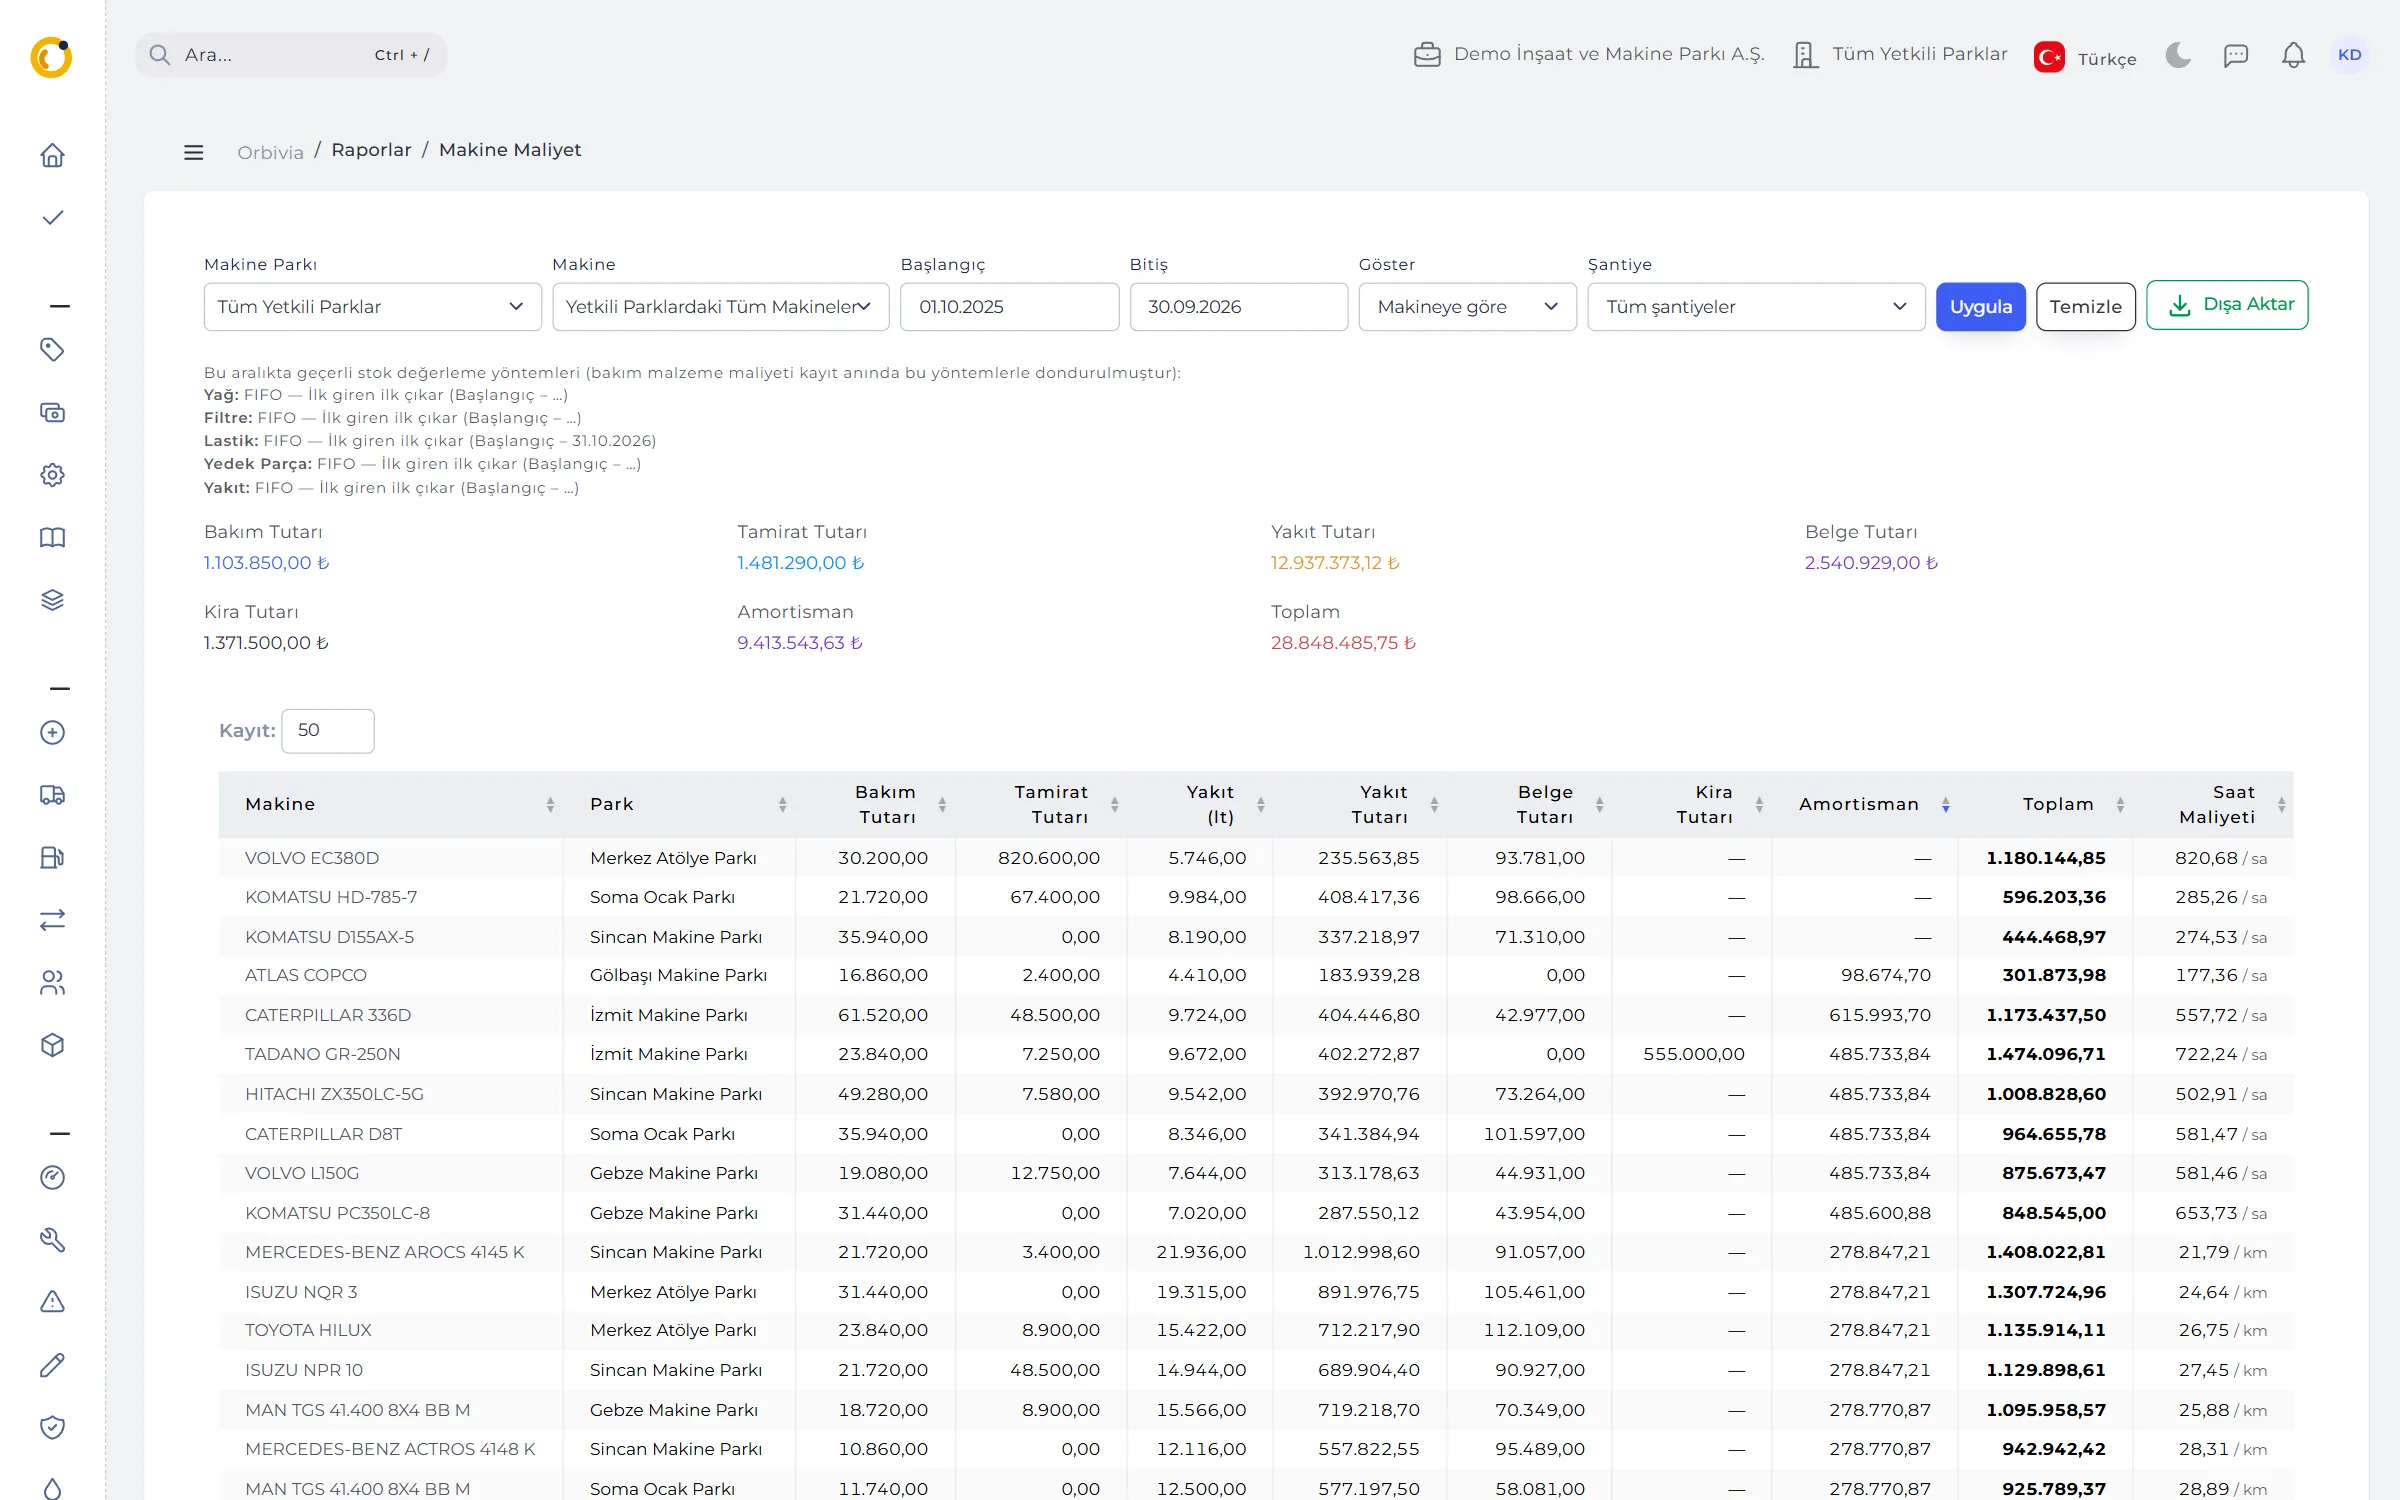
Cost per machine, per hour, per project.
The Machine Cost report adds up maintenance, repair, fuel, document and rental costs plus straight-line depreciation, and gives cost per hour or per km. Fuel is costed day by day: the tank issue if the machine was fuelled from a tank that day, otherwise litres × price from the daily log.
- By project: each day’s cost goes to that day’s project, found from the daily log, the shift or the geofence the telematics position fell into.
- The right site: for a transferred machine, maintenance and repairs stay with the site where the work was done.
- Export: every report to Excel, XML, YAML and JSON, with report name, period and filters in the file.
- Monthly e-mail: on the 1st of each month, chosen reports arrive as Excel attachments, in the user’s language and within their permissions.
02REPORT LIST
Twelve reports plus budgeting.
Reports never change a record. A Site Manager only sees their own sites’ figures; cost columns open only to users allowed to see prices.
Machine Cost
Maintenance, repairs, fuel, documents, rental and depreciation; cost per hour or km; breakdown by project.
Fuel Consumption
Litres, amount and l/h or l/km per machine.
Fuel Reconciliation
Expected vs. measured in tanks; dispensed vs. logged per machine.
Operator Performance
The same machine with different operators: shifts, hours, fuel, l/h and breakdowns opened.
Maintenance History
Services in the period; amount, materials and who did the work.
Maintenance Compliance
Share of preventive services done on time, site × month; with the ±10% rule.
Repair History
In-house / external / mixed; labour, parts and the linked breakdown.
Breakdown History
Number of downtimes and breakdowns, total and average downtime, split by root cause.
Counter Tracking
Machines with no counter entered and machines silent for 7 days; “no entry” kept apart from “did not work”.
Machine Scores
Availability (MTBF, MTTR), maintenance compliance and a replacement score out of 30.
Utilisation
Working ÷ available hours; idle time and under-used machines.
Carbon Emissions
Scope 1 direct emissions with IPCC factors; tonnes, kg/h and by site.
Budget vs. Actual
Monthly maintenance, repair and fuel budget by site, project or machine type.

03MACHINE SCORES
Decide which machine to replace with data.
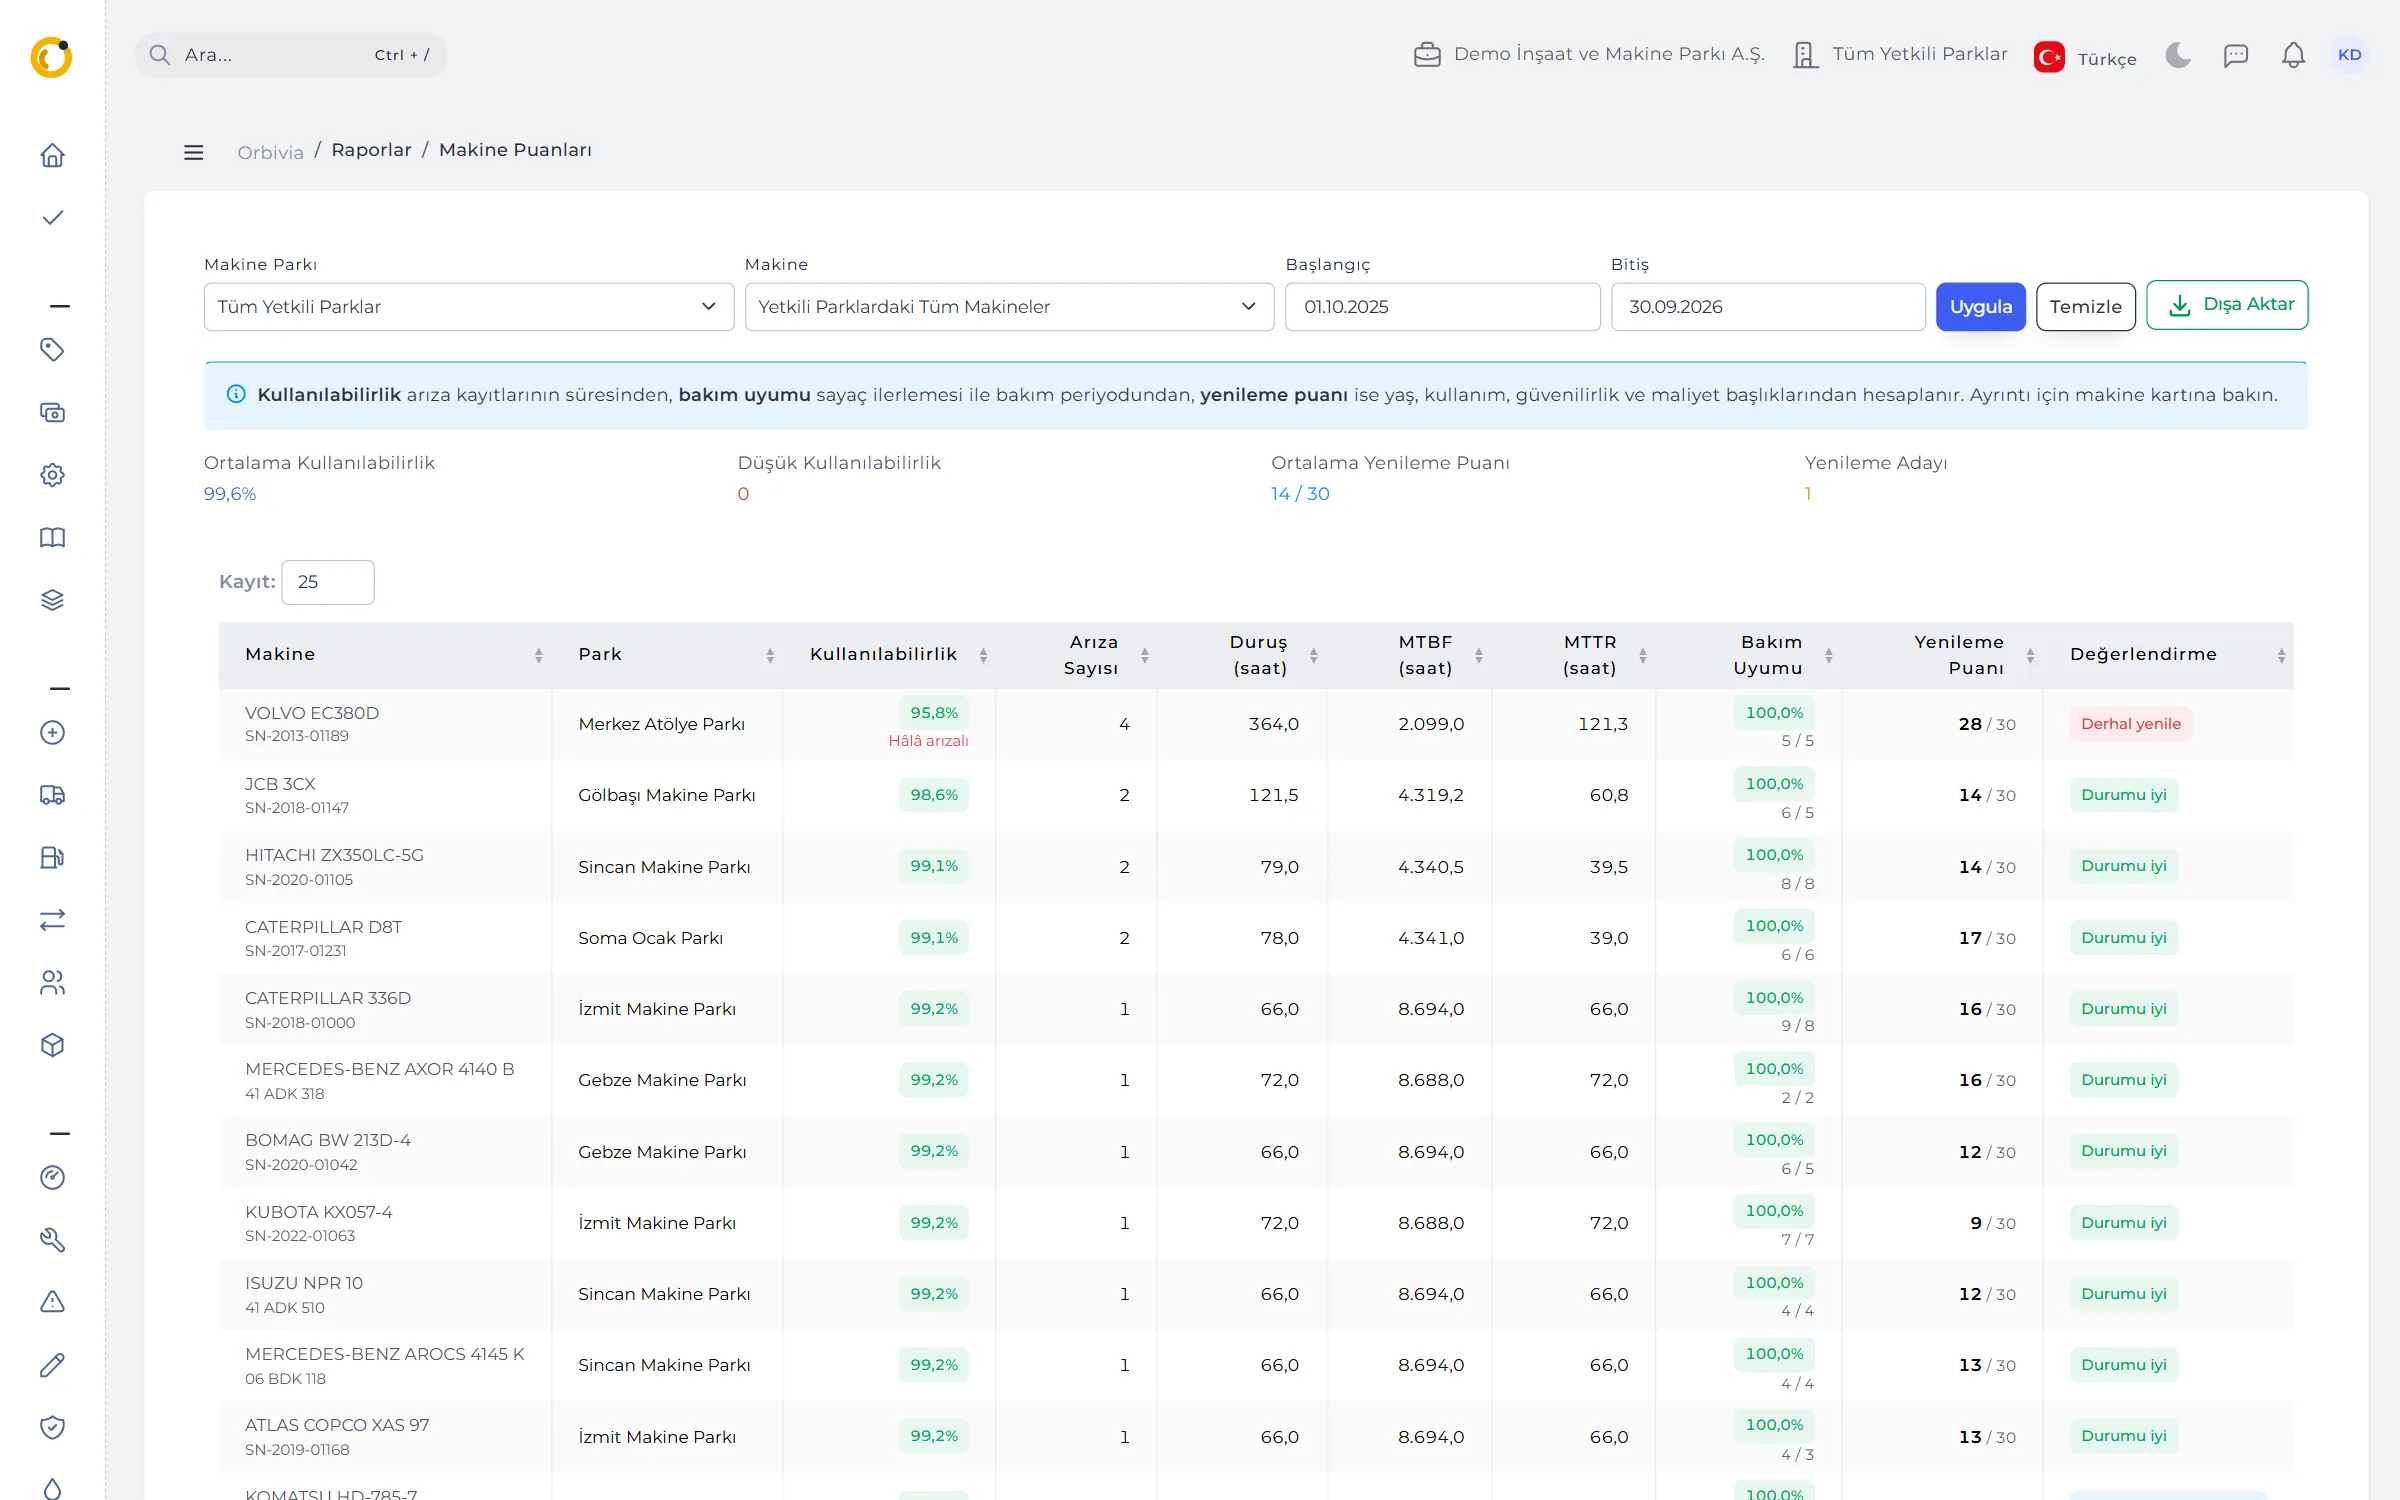
Three scores, never blended into one number: Availability (time not down, with MTBF and MTTR), Maintenance Compliance (services done ÷ services expected) and the Replacement Score.
- Replacement Score: age, usage, usage intensity, reliability, repair cost / value and physical condition; each 1–5, 30 in total.
- Decision bands: 28–30 Replace now · 23–27 Add to replacement list · 18–22 Review next year · 17 or below In good shape.
- Transparent: a heading with missing data is skipped and the score rescaled to 30; “How was this score built?” shows every value.
04UTILISATION AND CARBON
Measure idle machines and emissions.
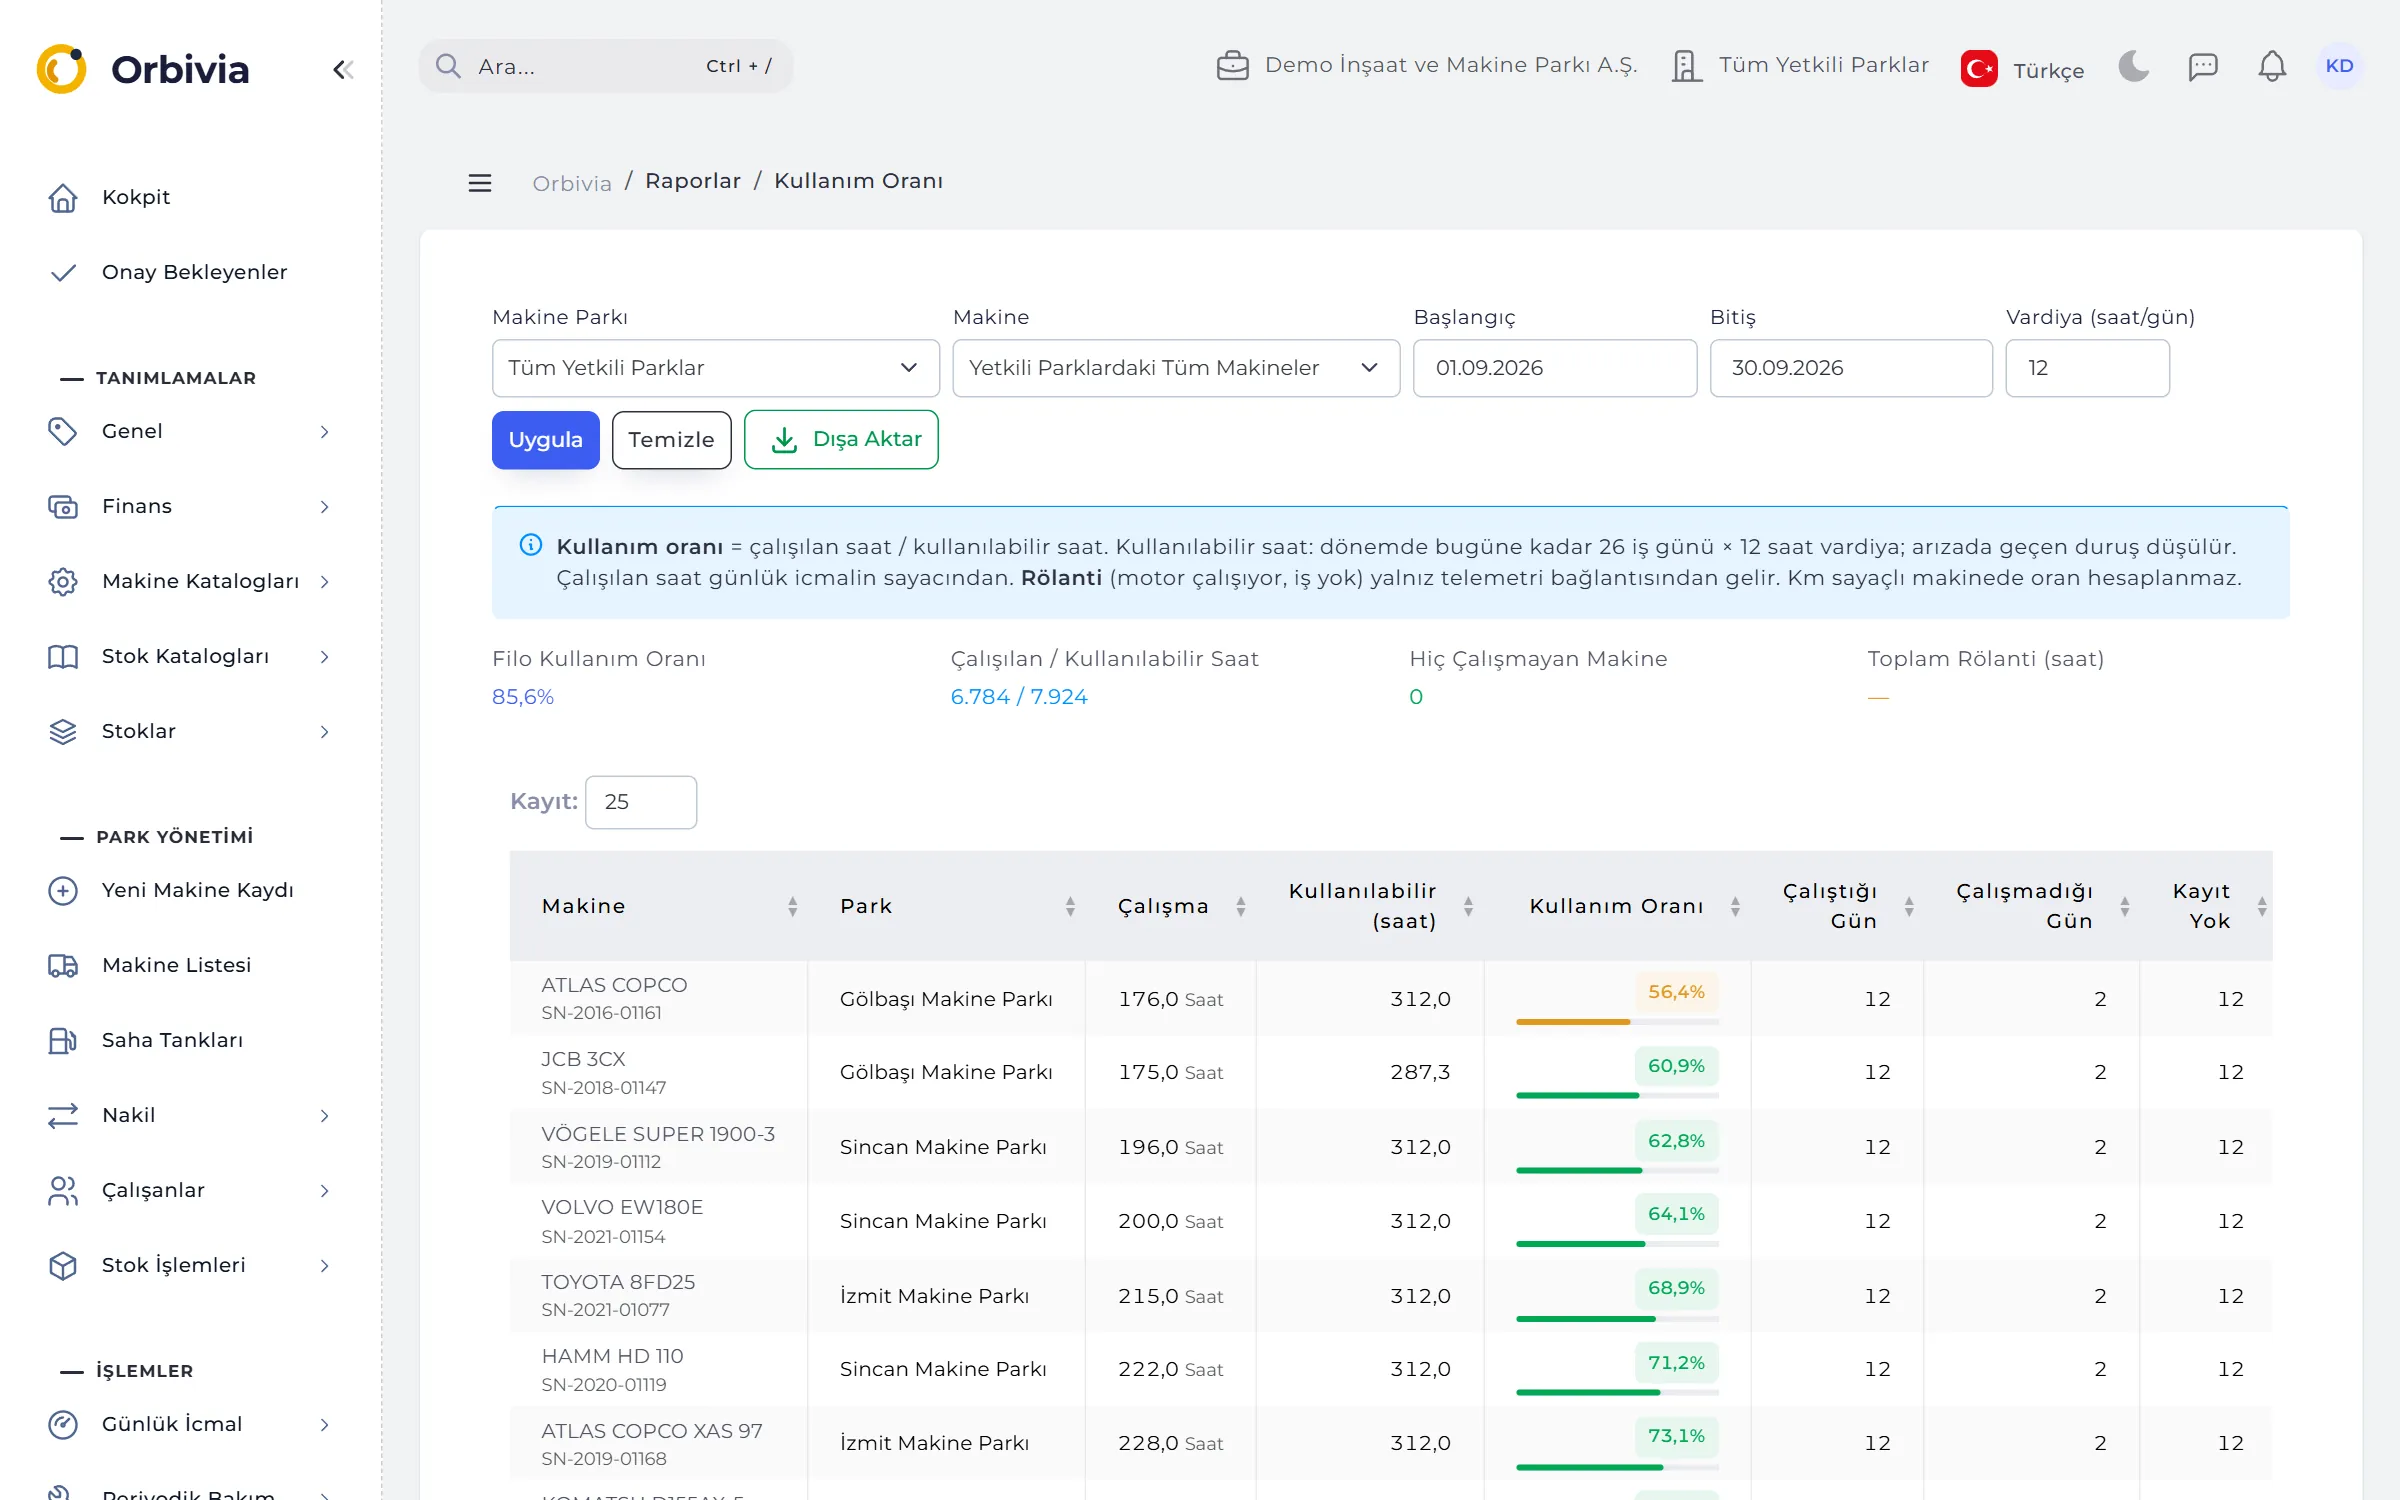
Utilisation divides working hours by available hours: working days × shift hours, minus time lost to breakdowns. Idle hours come from telematics. Carbon Emissions calculates Scope 1 direct emissions from fuel given to machines using IPCC factors (diesel 2.68, petrol 2.31 kg CO₂/l).
- Utilisation: fleet utilisation, machines that never ran and total idle time; 60% and above is green.
- Carbon: total in tonnes, kg/h or kg/100 km and a per-site split; for tenders and client requirements.
05BUDGET AND ACCOUNTING
Build the budget from last year; hand costs to accounting in one file.
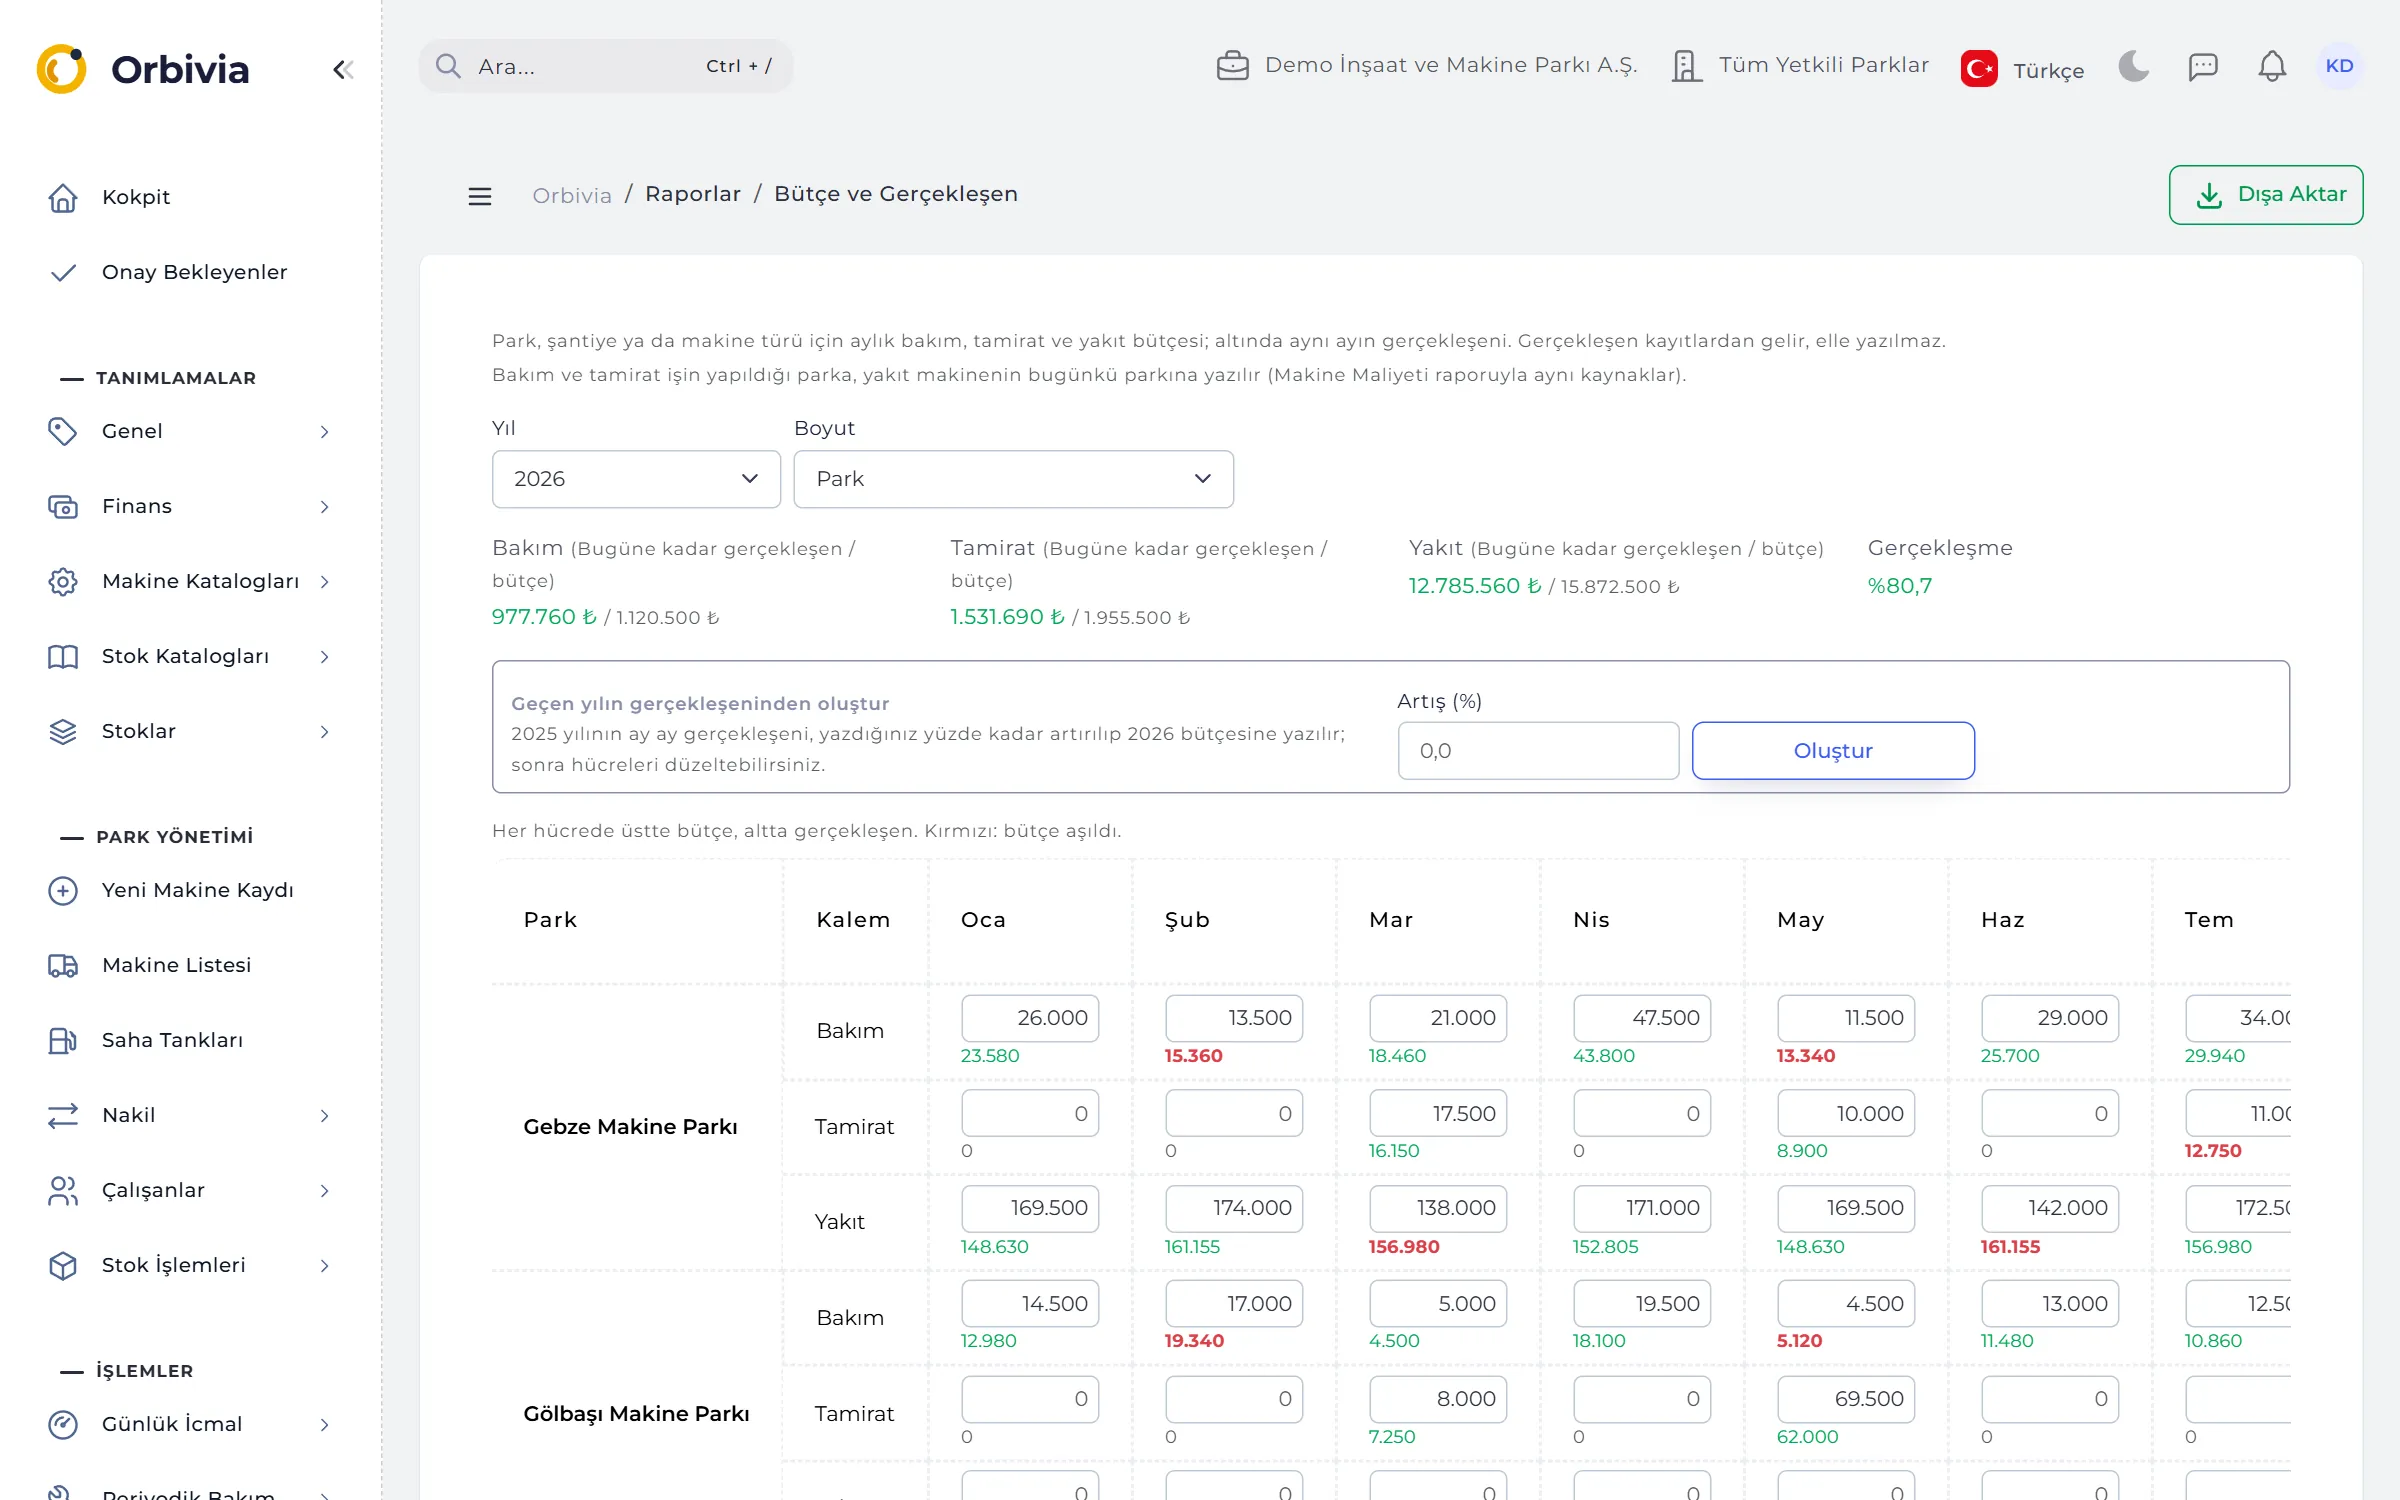
A monthly maintenance, repair and fuel budget is kept per site, project or machine type; actuals come from records. Last year’s actuals become the budget in one click with the increase you choose; overruns show red in the table, as a bar on the Cockpit and as an alert in the bell.
- Accounting export: journal vouchers or invoice lists that programs such as Luca, Logo, Mikro and Zirve can import; Excel, CSV, JSON or XML.
- No double posting: exports are numbered and a record is never exported twice; records changed afterwards are flagged “Changed”.
- Account codes: defined once per cost type (with chart-of-accounts suggestions); never asked during data entry.
06INCOMING E-INVOICES
Suggestions to match each invoice to its record.
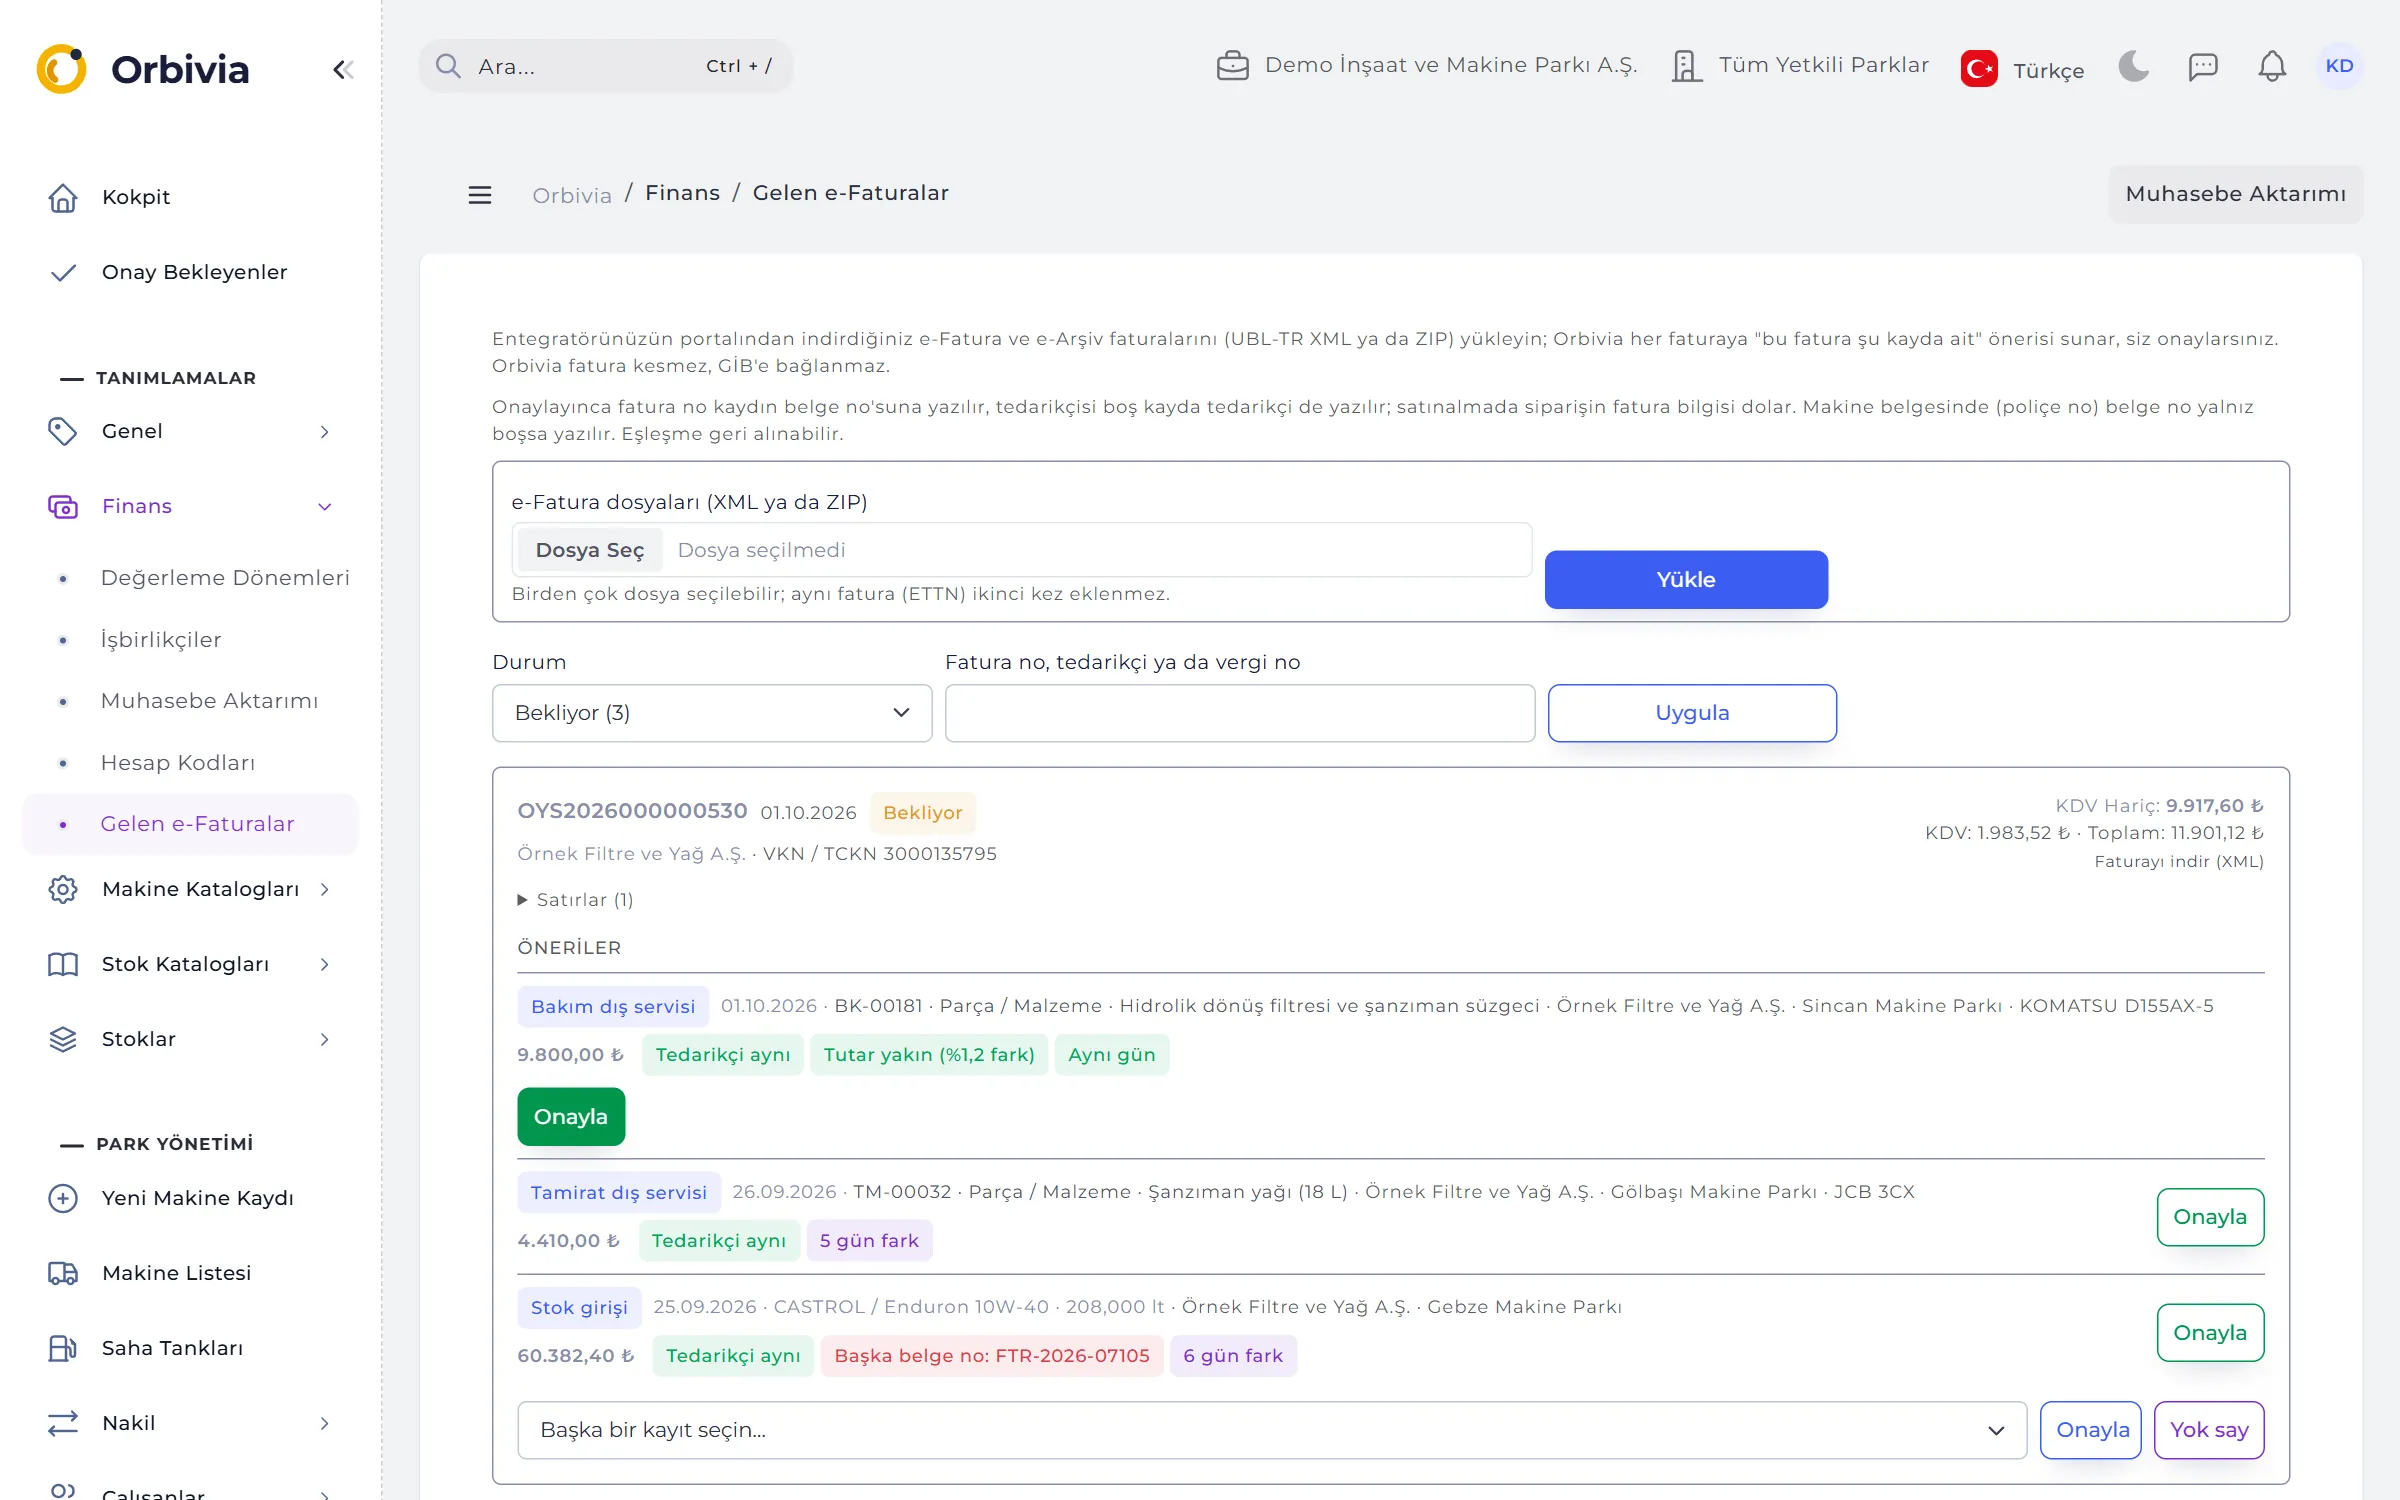
Upload e-Invoice and e-Archive files downloaded from your integrator portal (Uyumsoft, eLogo, Logo, Mikro…) as XML or ZIP. For each invoice, Orbivia suggests matches among costs from 60 days before to 15 days after the invoice date and among received purchase orders.
- Reasoned suggestions: “Same supplier”, “Same or close amount”, day difference; the best three can be approved in one click.
- No duplicates: the same invoice is never added twice (ETTN or tax ID + invoice number); suppliers are matched by tax ID.
- Clear boundary: Orbivia is not an integrator; it doesn’t issue invoices or connect to the tax authority.
07INTEGRATIONS
Telematics, GPS and fuel data without manual entry.
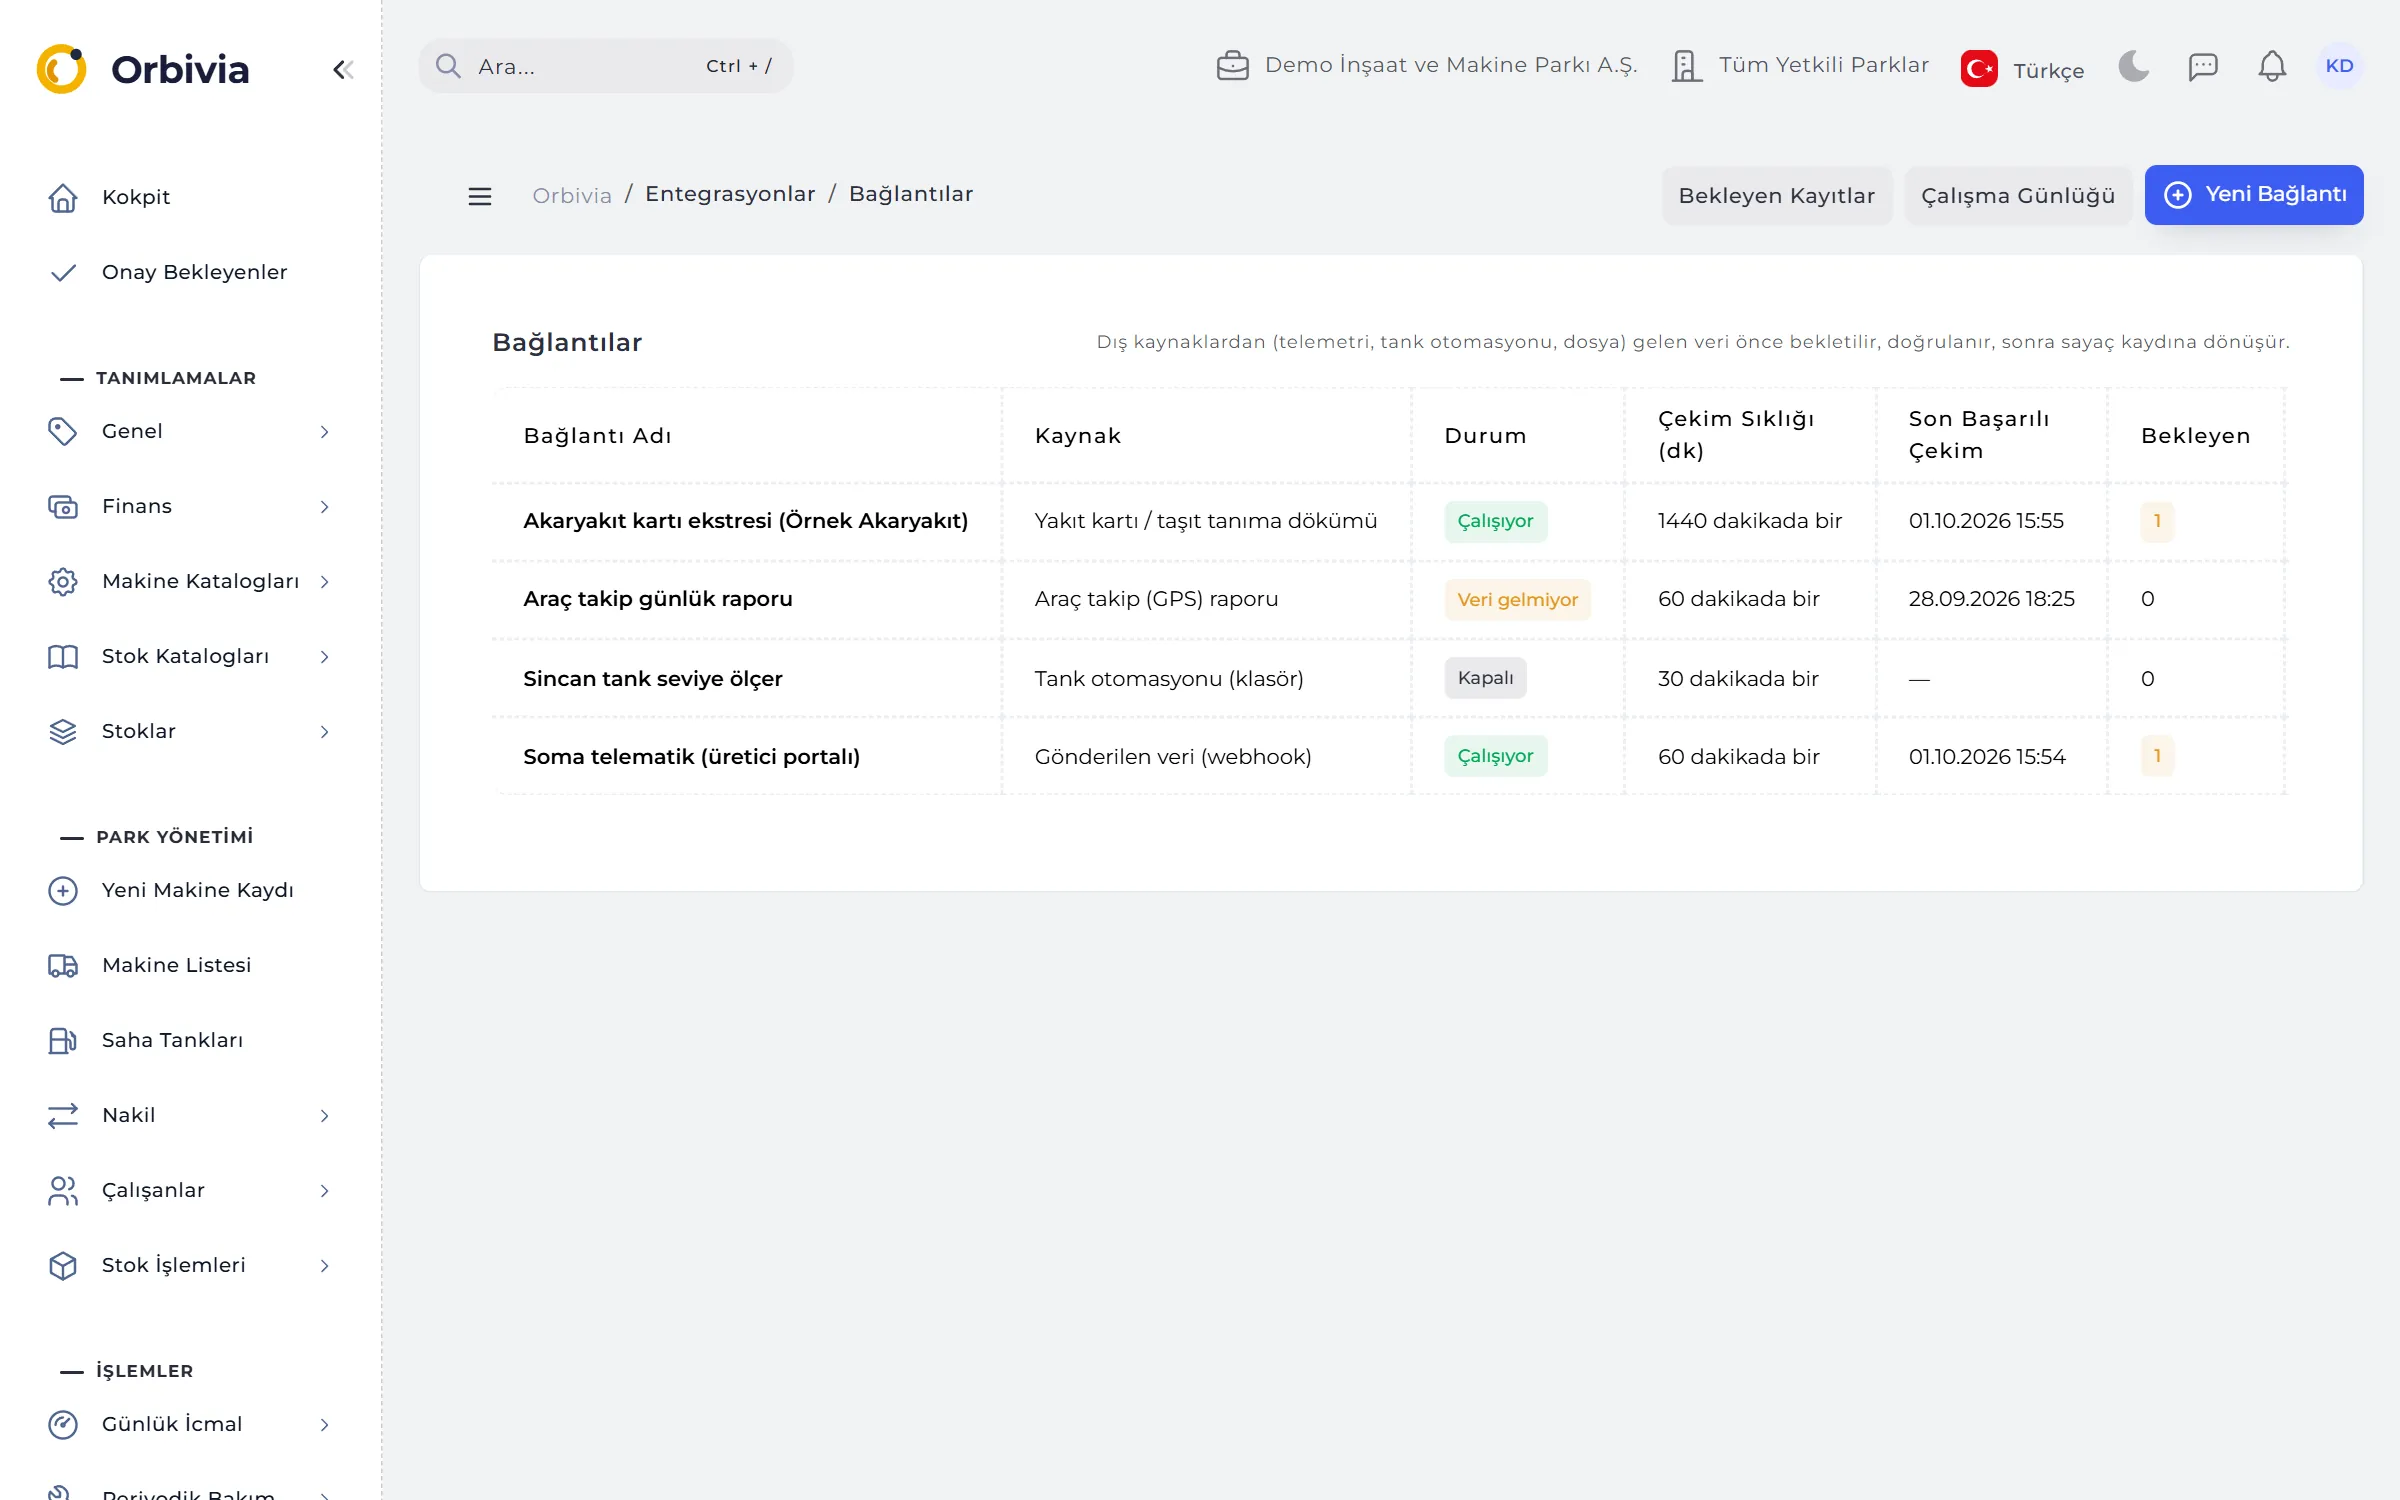
A connection pulls the data or the other side pushes it; each record is matched to a machine, passes quality rules and is written as a counter, fuel, location or tank movement. Suspicious records wait for a decision in Pending Records; nothing is ever deleted.
- Telematics: ISO 15143-3 (AEMP 2.0); hours, km, location and fault codes from manufacturer fleet portals.
- Vehicle tracking (GPS): engine hours, km, idle time and location from reports by providers such as Arvento, Mobiliz and Infomobil.
- Files and webhooks: tank automation and CSV / Excel files from a folder; webhooks signed with a secret key.
- Automatic matching: chassis no → serial no → engine serial no → plate → machine code; a matched number is remembered.
- Fault code rules: by SPN/FMI code: ignore, store or open a breakdown; when a code goes quiet, a “fixed” suggestion.
- API tokens: write counters / fuel, read the machine list, read upcoming maintenance, report faults and write tank movements — capability by capability.
RULES
Data quality rules
Incoming data never overrides what people entered by hand:
Manual entry wins
Telematics never changes a counter entered by hand or by file on the same day.
Suspicious records wait
If the machine doesn’t match, or the counter goes backwards or jumps too far (default 24 hours / 1,500 km a day), the record waits for a decision.
Duplicates are skipped
A second record with the same number and time is marked “Duplicate”.
Silent connections
A connection with no data for 48 hours raises an alert on the Cockpit; after 5 failed pulls in a row it switches off.
See it with your own fleet.
Leave a demo request and try Orbivia with your own machines, sites and projects.